Cruise TIR 1999 was designed to accomplish the task of the full coverage swath bathymetry mapping of the Tyrrhenian Basin (Fig.2), from the isobaths of 800-1000 m, after the first cruise in september-october 1996 (chapter 2) that mapped the Central and Southeastern portions. The collection of other geophysical data along the multibeam tracks, such as magnetics, gravity and single channel reflection seismic was planned as well.
figure
R/V Strakhov of GIN was used. The cruise left Catania 4-feb-1999. Calibration of the two multibeams were performed 5-feb-1999 north of the Eolie Islands. During the first leg in february we worked primarily in the Sardinia Channel up to the Northern tip of Sardinia. Some lines were also run from Sardinia to Italy north of 40N.
figure
Weather conditions were very bad for more than half of the leg. We were forced to a 12 H stand-by to Favignana and 24 H to Capri and Ischia.
The leg ended with a port call to Civitavecchia on 1-mar-1999. During the two day stop a partial takeover of the scientific crew occured. The second leg started 3-mar-1999 and covered the Northern part of the basin. The last week was instead devoted to collect data in the South-eastern margin and in the Eolie Islands (mainly Stromboli and Panarea), to try to fill some gaps from the cruise of 1996.
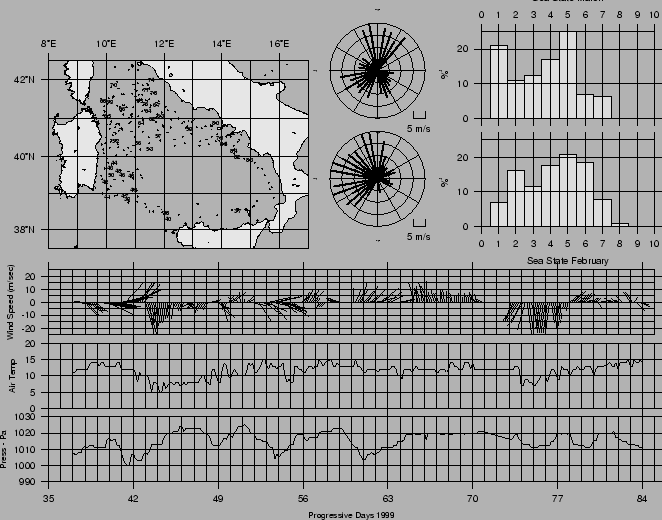
The weather conditions during the leg were bad, especially the first and third week. No stand-by meteo occured. The cruise ended in Catania 1-apr-1999. Fig. 12 summarizes the metereological conditions, which are also presented in Appendix 6.3. It is worth to note that more that 50% of the cruise had sea state higher than 4-5. The prevailing winds and seas were from the WSW to NNE sectors.
Hereafter, a description of the equipment and of their usage is given, along with details of the general setting, performances and results (Chapter 3.4). Chapter 3.4.2 presents the Oceanographic setting and the problems encountered in the sound velocity data acquisition and processing. Chapter 4.1 describes the swath bathymetry data processing.