


Next: DATA ORGANIZATION AND SOUND
Up: SWATH BATHYMETRY
Previous: CALIBRATION
Contents
SOUND VELOCITY ANALYSIS
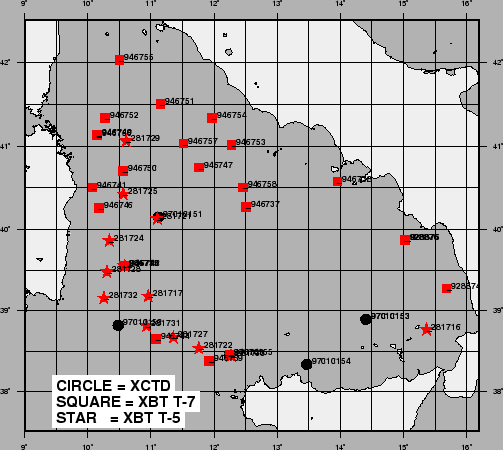
During the Multibeam mapping several Sippican XBT and XCTD probes were launched,
with a higher frequency in areas of greater variability of the water column properties, i.e.
the Sardinia Channel and the Northern Basin.
Fig. 15 shows the position of the sampling stations. Further
information, including time,date and position information (Tab. 12)
can be found in Appendix 6.5.
In the investigated area we can report the following features and
subdivide the region into homogeneous areas:
- AREA a
- NW of the Sicilian coast the upper layer of the water column (0-100m)
is occupied by the incoming MAW, marked by a lower salinity (less than 37.8 PSU).
Down to about 700m the incoming LIW is characterized by temperature and
salinity maxima (T=14.4C at 100m, S=38.7 PSU at 600m).
- AREA b
- N-E of the Sicily coast and along the Calabria coast the salinity of
the upper layer increases (37.9-38 PSU) due to the mixing of the incoming
MAW with the water of the basin. Nearshore the depth of
the temperature maximum deepens down to 200m. The surface temperature
in the whole area was found to be higher (T=14.5C) than in
area A.
- AREA c
- In the middle of the basin the values of the subsurface
temperature and salinity maxima were found at a deeper depth
than in B (300m and 500m respectively) and the
temperature values ranged from 14.1C at the Sardinia side to
14.3 C at the Campanian coast.
- AREA d
- North of 41 the data showed
a great variability of the surface temperature values (from 13.2 to 14C)
and of the vertical temperature profiles, that presented several oscillations.
All of these features are typical of a zone of intense mixing.
- AREA e
- South of 40 down to 39
the temperature profiles were found similar to those of area
C, except for the depth of temperature maximum at 200m instead of
300m.
- AREA f
- In the Sardinia Channel toward the Sardinian coast, the MAW
was found from the surface to the depth of 100m, with salinity higher than 38.1 PSU
and temperature range between 13.6C and 13.8C. Down to 700 m the
modified LIW was characterized by a temperature maximum (T=14.1C) at 100m
and by a salinity maximum (S=38.7 PSU) at 300m.
The XBT and XCTD data are presented in Fig. 16, 17,
18.
figure
Figure 15:
TIR99: location of XBT and XCTD probes.
 |
Next: DATA ORGANIZATION AND SOUND
Up: SWATH BATHYMETRY
Previous: CALIBRATION
Contents
2001-07-13