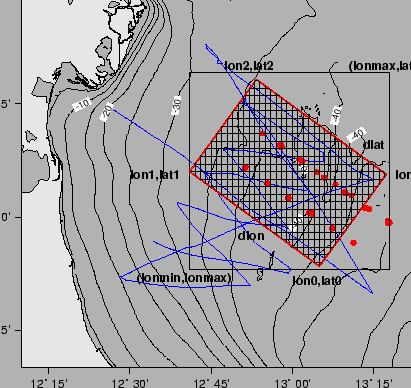
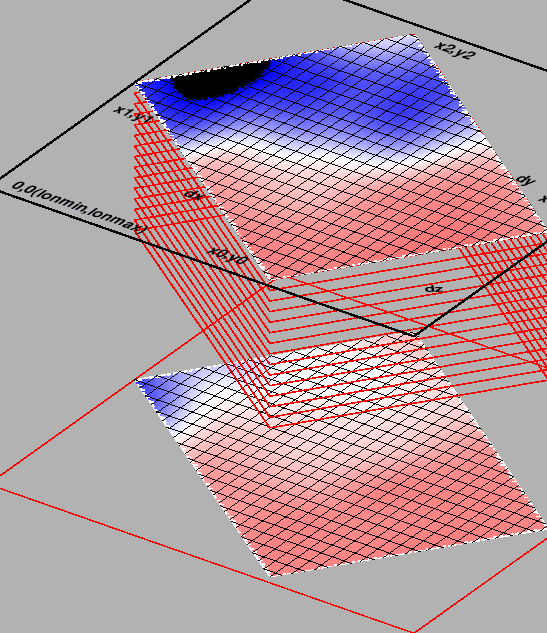
The operations involved in the procedure (Figs.2 and 3) can be summarized as follows:
figure
 |
figure
 |
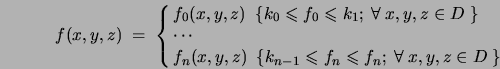
In a mathematical form we state that, given the 3-D function ![]() ,
represented by the
,
represented by the ![]() rectangular grids defined by
rectangular grids defined by
![]() of Fig.2 and 3,
we can subdivide it categorically such as:
of Fig.2 and 3,
we can subdivide it categorically such as:
where the ![]() parameters define the function intervals and where
parameters define the function intervals and where
is the set of points that are delimited by the polygon defined by ![]() (Fig.2) and
(Fig.2) and ![]() (Fig.3) for
(Fig.3) for ![]() , in this case
, in this case ![]() .
.
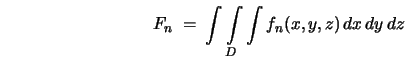
The volume integral for each ![]() interval of
interval of ![]() is therefore calculated as:
is therefore calculated as:
The procedure was performed on a GNU/Linux computer using the Perl and C programming language and some of the GMT suite of programs [10],[11]. SQL queries provided access to the SARAGO position ( Lat, Lon, Depth), time, salinity and temperature data.
The core of the procedure is the gridding, filtering and masking of the data (ROI and final depth surface) (STEP D above).
We used GMT's surface, a global, adjustable tension continuous curvature surface gridding algorithm [12],
and grdfilter, whereas the ROI masking was done with grdmath.
The volume calculations in all the cases of Eq.1, was then performed on the masked surfaces by
the sum
of the non NaN values on every depth slice, using GMT's grd2xyz.
The program is also able to output
binary volume data which can be processed with other software for visualization, such as IDL or MATLAB.
In addition to this, the IGM topographic library Tplib was used, alongwith a C program
to interface a MySQL database and get data on output according to an SQL query
on the command line.
The PERL script listed in Appendix was developed to make the procedure as automated
as possible. The only input required are the operator's choices of the geographical box, by providing a two
point segment and left or right offset (to define a rectangular box), and a fine
tuning on data (particularly on the base levels).
Other parameters control the spacing of the grids, the filter parameters, etc.
Even though not tested, we believe that the procedure could be easily tailored
to the input of other data, such as STD samples, with the contraints
and limitations due to the much lower degree of sinopticity.
The procedure
is suitable to be performed in other computing environments like WINDOWS, provided
that the GPL'ed GMT, Perl and C compiler and PostScript viewers
like Ghostscript and ghostview are available.