The Tyrrhenian Sea exchanges water with the rest of the Mediterranean Sea through the Sardinia Channel, the Sicily Strait and the Corsica Channel (Fig. 2), that represent morphologic constraints for the circulation of the intermediate and deep waters. The surface water (0-200m) entering the Tyrrhenian Sea through the Sardinia Channel is the Modified Atlantic Water (MAW) from the Algerian Current (AC) ([23], [24]). The MAW is characterized by low salinity (on average less than 38 PSU), and flows cyclonically along the italian coast.
Through the Sicily Strait and deeper than 200 m down to about 700m, the basin receives the Levantine Intermediate Water (LIW), which is marked by a subsurface temperature maximum and by a higher salinity (on average 38.8 PSU), and mixes with the surface MAW and deeper water masses [25].
From about 700 m to the bottom the Tyrrhenian Deep Water (TDW) is present, being the result of the modification of the West Mediterranean Deep Water (WMDW) that crosses the Sardinia Channel ([26], [27]).
The circulation pattern in the Tyrrhenian Sea is normally characterized by two cyclonic gyres in the south and in the northern basins, and by the presence of cyclonic and anticyclonic eddies in the central basin. MAW can reach the Ligurian sea through the Corsica channel.
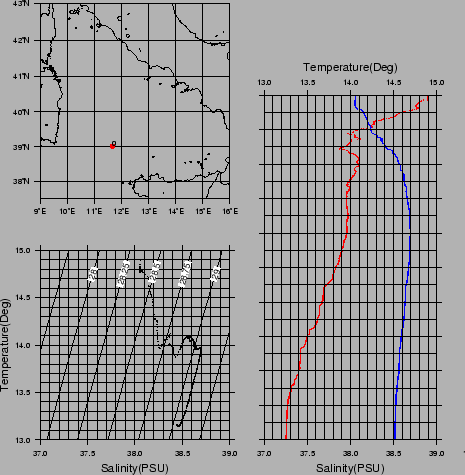
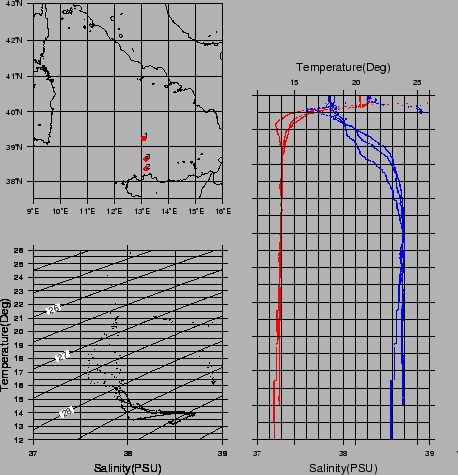
During summer a strong thermocline occurs (Fig. 3).
Fig. 3 and 4 show CTD data retrieved from MEDATLAS [11] that are representative of different summer and winter water masses (see further discussion on chapter 3.4.2 for the data collected during TIR99).
figure
 |
figure