


Next: SURFACE TEMPERATURE AND SALINITY
Up: INITIAL RESULTS
Previous: SBP
Contents
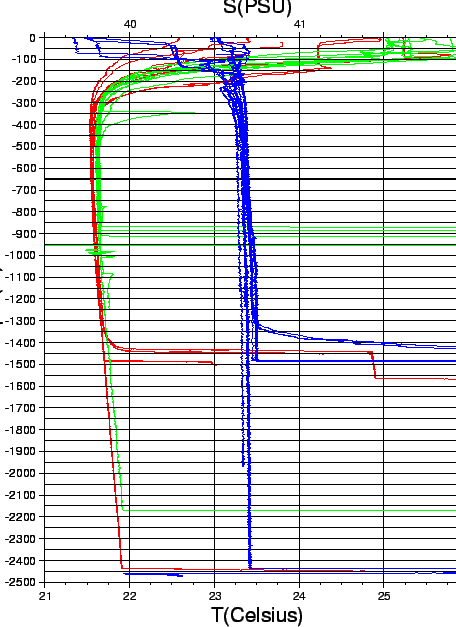
The CTD station descriptions are presented in Tab.4, whilst
the more interesting CTD/XBT data are presented in Fig. 21.
figure
Figure 21:
Temperature and Salinity plot of CTD (red, blue) and XBT (green) casts.
 |
Subsections
2005-11-05