next up previous contents
Next: WATER SAMPLING Up: OCEANOGRAPHY Previous: OCEANOGRAPHY   Contents

SURFACE TEMPERATURE AND SALINITY

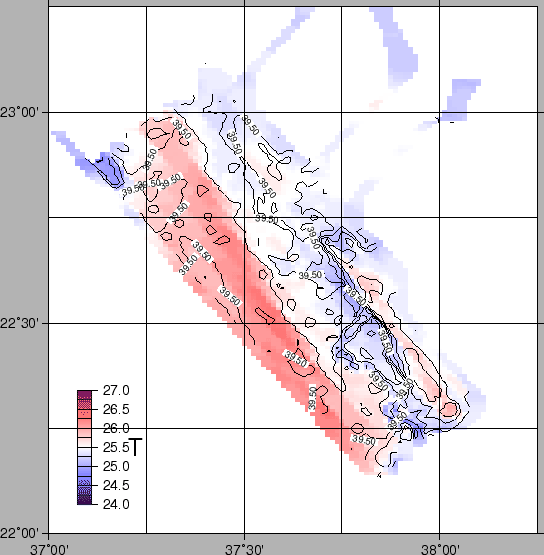
The data recorded by the NAVPRO navigation system were used to produce maps of the surface temperature and salinity (at 3.5 m below the sea level). Figure 22 shows the results in the Thetis Deep area. These results, though at a low level of spatial and temporal synopticity, may be useful for oceanographic studies and for the reprocessing of the multibeam data set.

figure

Figure 22: Surface temperature and salinity in the Thetis Deep. From 2005-01-07 to 2005-01-15. Salinity data corrected with the procedure explained in 4.2.2
\begin{figure}\centerline{
\epsfig{
file=IMG/RS05_TEMP.eps,width=12cm}}\quad
\end{figure}


2005-11-05