The methodology presented in this report was used to model the 3-D salinity fields in 7 areas of NW Adriatic Sea in summer and winter conditions. Input data were the quasi-synoptical CTD measurements acquired by the undulating tow-fish SARAGO, which provided a large dataset (n=500000) covering almost the entire water column, from surface to few meters above the sea bottom. The density of the data, although relatively polarized on the ship's track, the fast acquisition rate, as well as the careful calibration of the sensors and the GPS georefencing ensured the good quality of the dataset.
After T/S analysis of the whole dataset, an upper limit of 37.00 PSU was chosen to trace the front as the boundary of the lower salinity waters directly influenced by freshwater lateral inputs. Therefore, the 3-D salinity model located the coastal front from 20 to 32 NM (northern area), and 6 to 23 NM (southern area) offshore. The surface and volume analysis of the 3-D salinity function provided the estimations of the inshore and offshore portions of the front. Moreover, the partial water volumes, relevant to increments of 1 PSU, were calculated in the inner portion of the front, thus allowing the evaluation of the quantity of "pure" freshwater (with salinity fixed to 0.00 PSU) which dilutes the coastal seawater. The result of this calculation, summarized in Tab.2, show a "pure" freshwater percentage ranging from 2 to 7% in the inshore northern area, and from 4 to 6% in the southern ones.
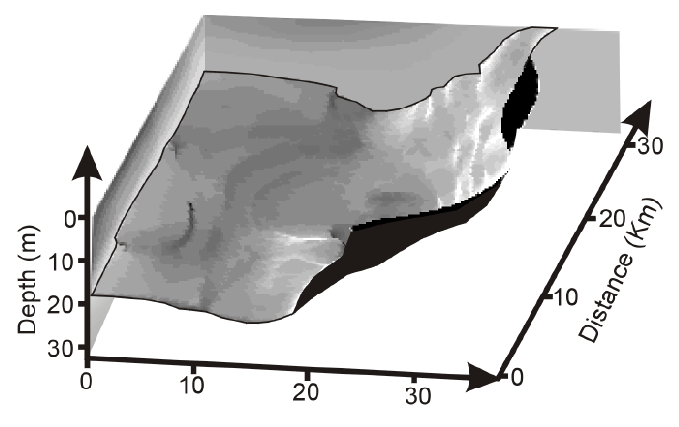
The structure of the coastal front of the NW Adriatic Sea evidences a much larger variability in the northern (Fig.5) areas than in the southern ones. The former area is directly influenced by some mouths of the Po River delta, whereas the southern one receives an indirect Po river contribution and more direct contribution of the other rivers located along the italian coast. An example of the coastal front structure can be seen in FIG.34.
In the northern area, the 3-D salinity fields basically depend on the extension of the Po River plume, and the lower salinity waters were found to be confined in an upper layer(14 to 23m of depth), thicker to the N. In addition to this, a complex pattern of salinity was normally found in the inner portion of the front, suggesting the overlap of several riverine inputs. In the southern area, the coastal front was generally restricted to a narrow and parallel-to-the-coastline belt, whose thickness ranged from 10 to 19 m and salinity trend was found to increase in the SW-NE direction.
The presented procedure provided the quantitative description of the salinity field which is the basic step for any attempt to quantify the biological and geochemical processes in these areas. An experiment of matching the physical 3-D description with biochemical data was elsewhere provided by [9], that aimed to estimate the major nutrient budgets and fluxes in the area.
| Cruise | Km |
Km |
Sal.Range | Vol |
Vol |
SW |
FW |
%FW |
| U1-North (June 96) | 14.3 | 823 | 31.04 - 38.29 | 8.0 | 6.3 | 5.9 | 0.4 | 7 |
| U1-South (June 96) | 12.5 | 713 | 34.14 - 38.70 | 6.9 | 5.6 | 5.3 | 0.3 | 6 |
| U2-North (Feb 97) | 27.4 | 1089 | 28.87 - 37.49 | 15.4 | 12.0 | 11.2 | 0.8 | 7 |
| U2-South (Feb 97) | 11.6 | 554 | 34.87 - 38.14 | 11.3 | 0.3 | 0.3 | 0.01 | 4 |
| U3-North (June 97) | 14.1 | 789 | 33.02 - 37.30 | 0.5 | 13.6 | 13.3 | 0.3 | 2 |
| U3-South (June 97) | 21.1 | 1032 | 35.12 - 38.11 | 12.9 | 8.2 | 7.8 | 0.4 | 4 |
| U4-North (Feb 98) | 11.6 | 648 | 34.77 - 38.27 | 9.8 | 1.8 | 1.7 | 0.1 | 4 |
We have presented a methodology which is supposed to be useful for the description and modelling of coastal fronts, in particular in the north-western Adriatic Sea, where the application was tested, obtaining an improved physical picture of the marine environment compared to traditional surveys based on CTD acquisitions in fixed sampling station. We focused our attention on salinity, which is the most important parameter for the description of freshwater advection in coastal areas, but any other parameter such as temperature, density, etc., could have been used. This 3-D modelling used undulating probe data, however, in the opinion of the authors, the described methodology is suitable of being generalized to standard CTD datasets, having in mind some conceptual and physical limitations due to the spatial and temporal variability of the marine environment.
As a matter of fact, the 3-D modelling is actually a 2-D (Latitude-y, Longitude-x) gridding propagated in the z (depth) direction, with a lower control on the function continuity in this last dimension. Supposedly, a more sophisticated statistical analysis or a plain 3-D gridding, more homogeneously and spatially expanded, will bring a better robustness to the model.
For this implementation we decided to mask the data down to the volume which was actually investigated by SARAGO. Using a dataset expanded trough the entire water column, the procedure may be able to propagate the salinity fields downward to the sea bottom, obtaining a more accurate picture of the entire water column, by clipping the 3-D function with available bathymetric grids.
The procedure and the accompanying library software, was made flexible enough
to possibly accommodate the data produced by other 2-D and 3-D gridding algorithms.
A further improvement in I/O flexibility, obtained with little modifications, will be the usage of ![]() coordinates
(instead of Lon-Lat), chosen among several cartographic projections. This is a must when dealing with
publicly available gridded data in some known cartographic reference.
coordinates
(instead of Lon-Lat), chosen among several cartographic projections. This is a must when dealing with
publicly available gridded data in some known cartographic reference.
It is hope of the authors that this methodology may constitute a tool for the assessment of the biogeochemical cycles in the Adriatic Sea as well in other coastal areas, or it may be helpful as input for more sophisticated models.