


Next: CRUISE U4
Up: EXAMPLES OF APPLICATION AND
Previous: CRUISE U2
Contents
Figures 22 and 26 show the data sample of SARAGO.
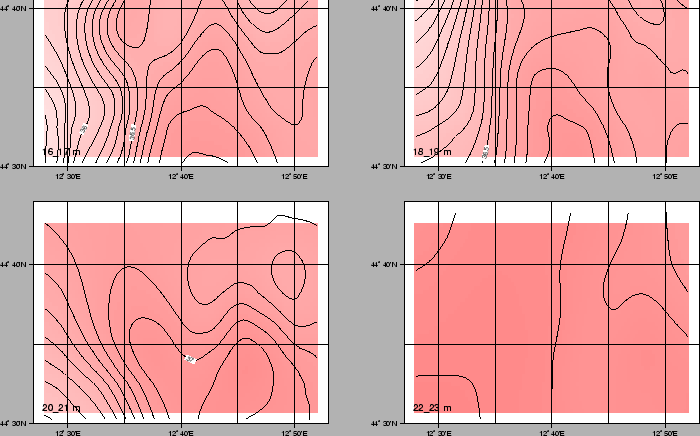
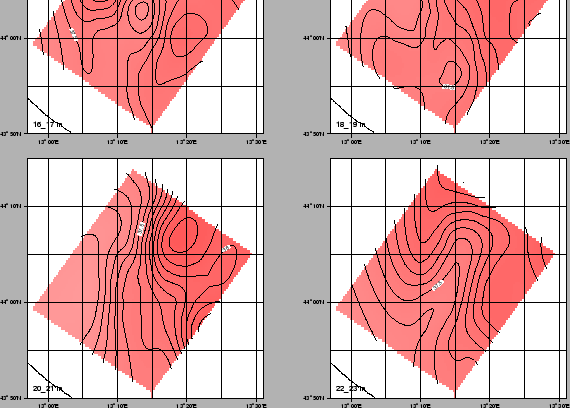
In the following pages the gridded salinity data are presented for
each slice at 1m interval (Figures 24, 25, 28 and 29).
Figure 22:
Cruise U3, northern area. Same as Fig.6.
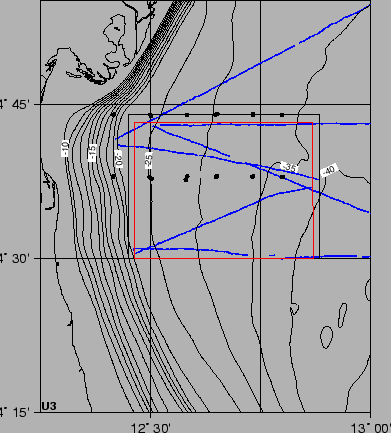 |
Figure 23:
Cruise U3, northern area. T-S diagram.
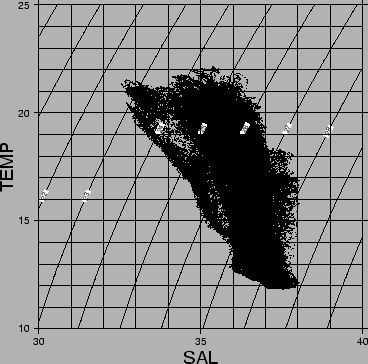 |
Figure 24:
Cruise U3, northern area. Same as Fig.8.
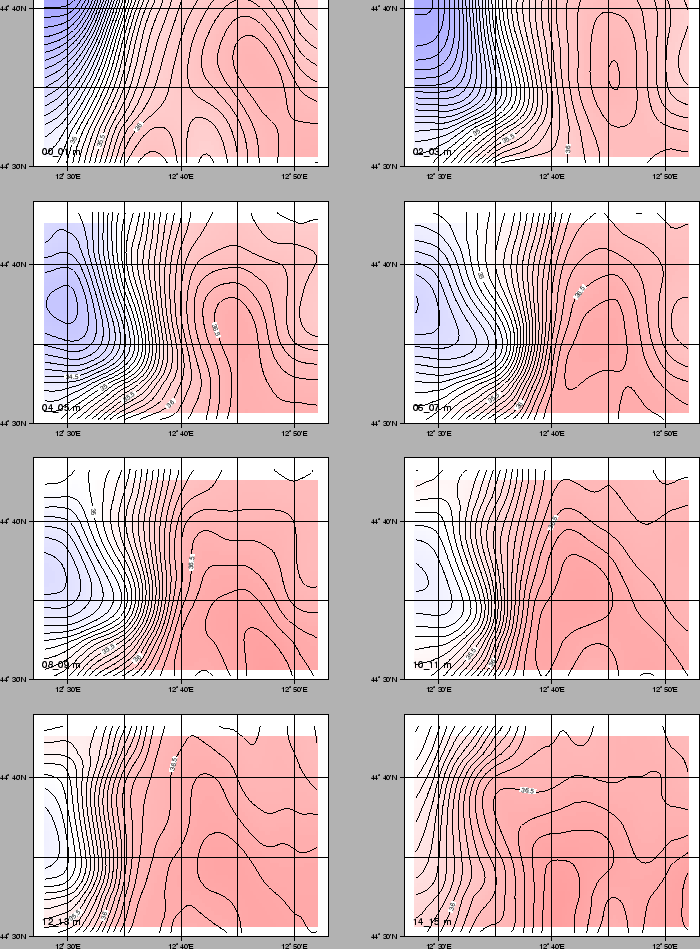 |
Figure 25:
Cruise U3, northern area. Same as Fig.8.
 |
figure
Figure 26:
Cruise U3, southern area. Same as Fig.6.
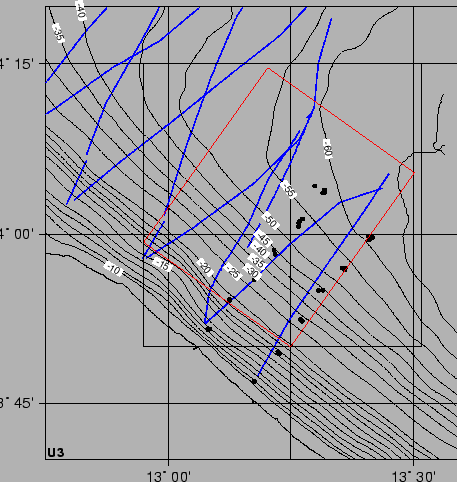 |
Figure 27:
Cruise U3, southern area. T-S diagram.
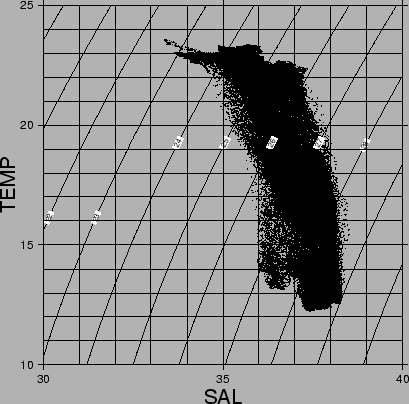 |
Figure 28:
Cruise U3, southern area. Same as Fig.8.
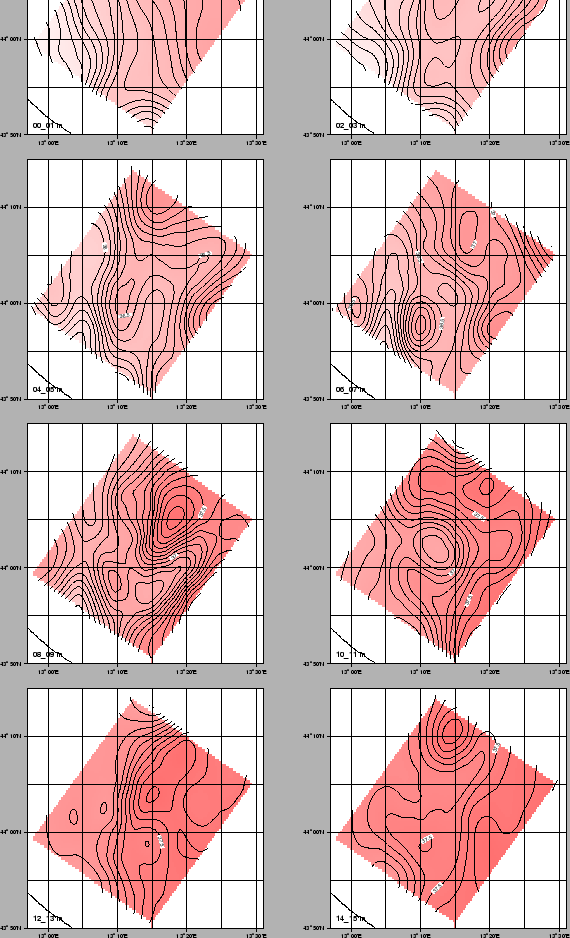 |
Figure 29:
Cruise U3, southern area. Same as Fig.8.
 |
Next: CRUISE U4
Up: EXAMPLES OF APPLICATION AND
Previous: CRUISE U2
Contents
G.Bortoluzzi
2001-07-16