


Next: SBP
Up: INITIAL RESULTS
Previous: SEABED SAMPLING
Contents
The data were processed on board. The IGRF reduced data ranged from -900 to
slightly above 1000 nT. Further processing will require the analysis of the
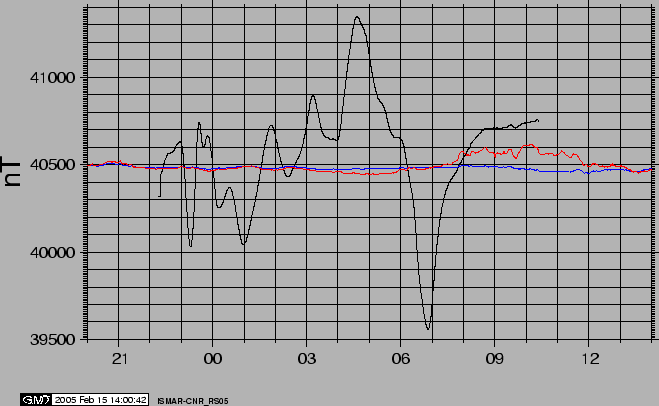
closest observatory data. Figure 19 shows one day of data collected
against the data of two INTERMAGNET observatories.
Figure 19:
Example of the data collected during the cruise
(median filtered, window 60 sec).
Also shown the unfiltered data from the INTERMAGNET observatories of
Addis Abeba (Ethiopia, long.38.77, alt.2400m), red line, and
of Qsaybeh (Lebanon, long. 35.6, alt. 540m), blue line. The
observatory data have been offset to the mean value of 40500 nT
for comparison.
 |
2005-11-05