Pattern of the multibeam lines during the 12 days of operation in the study area
are presented in Fig.4. A surface of approximately 8500 Km![]() was
covered in the Thetis, Conrad, Oceanographer Deeps and Coral Sea Peak areas.
A partial processing of the acquired data by the RESON 8160 was carried-out
during the cruise with the Caraibes and Neptune softwares.
The quality of the data acquired varied from very good to acceptable,
excluding a few lines obtained in bad weather conditions because of the rough seas.
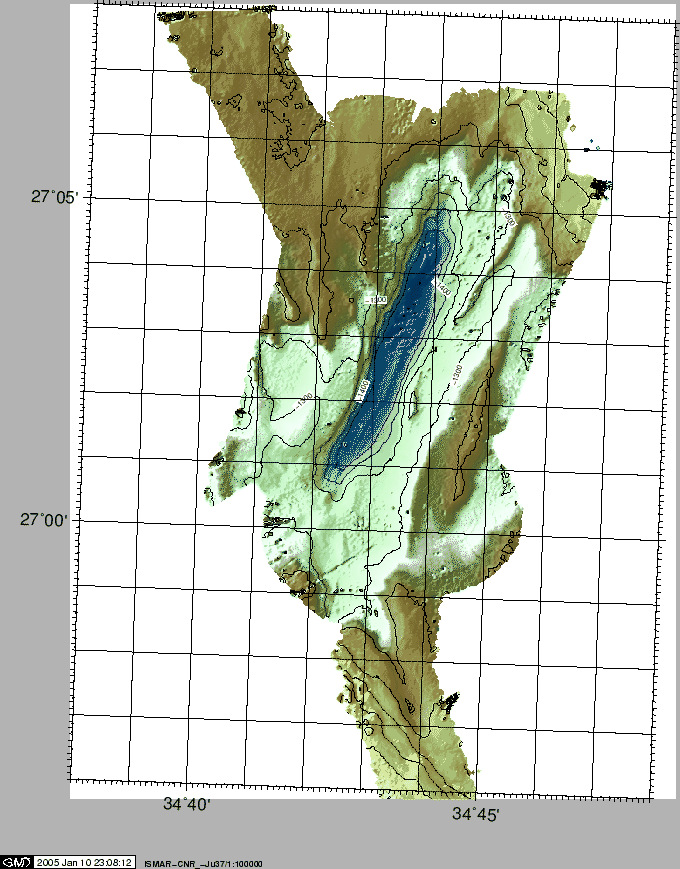
A detailed survey was carried-out in the Thetis Deep area extending the
survey to the south in the transition zone to the Hadarba Deep and to north
in the transition zone to the Nereus Deep, where the eastern
margin was also mapped during the water sampling operations and transit
to the Coral Seapeak.
was
covered in the Thetis, Conrad, Oceanographer Deeps and Coral Sea Peak areas.
A partial processing of the acquired data by the RESON 8160 was carried-out
during the cruise with the Caraibes and Neptune softwares.
The quality of the data acquired varied from very good to acceptable,
excluding a few lines obtained in bad weather conditions because of the rough seas.
A detailed survey was carried-out in the Thetis Deep area extending the
survey to the south in the transition zone to the Hadarba Deep and to north
in the transition zone to the Nereus Deep, where the eastern
margin was also mapped during the water sampling operations and transit
to the Coral Seapeak.
The DTM and maps were produced by (a) filtering the UTM-37 25m PDS-2000 DTM data
with a batch ISMAR procedure (filter_bat) to eliminate spikes and high-frequency
noise, (b) creating NETCDF grids with the GMT nearneighbor or surface
algorithms or straight to with xyz2grd, (c) gaussian filtering,
when required, and (d) plotting the maps in the UTM and geographical domains (GMT routines
complemented by ISMAR routines).
The bathymetry of the Thetis deep shows three asymmetric "subdeeps" which are smaller and shallower from north to south. The "subdeeps" are separated by transition zones and are characterised by several volcanoes and evaporite-mobilization structures. The structural architecture of the deep is generally formed by a series of fault segments with dominant NW orientation, sub-parallel to the rift axis. These are linked by relay ramps, some of which are breached by local transfer faults.
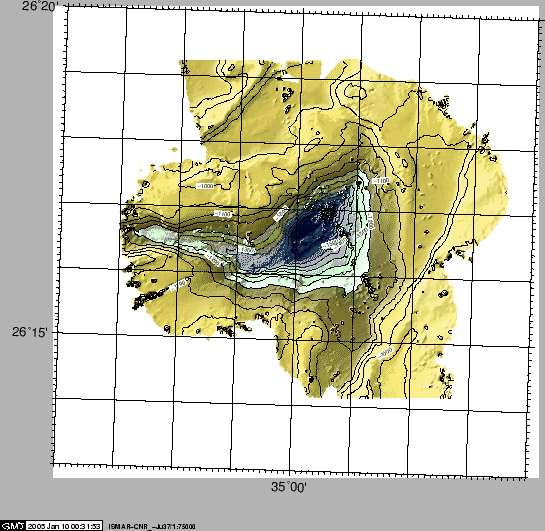
The Conrad Deep (Fig.16) shows an elongate shape, oriented parallel to the Aqaba-Dead Sea fault, and the Oceanographer Deep (Fig.17), seems to be in some way connected to the Brothers islands, localized and very close right west of the deep.
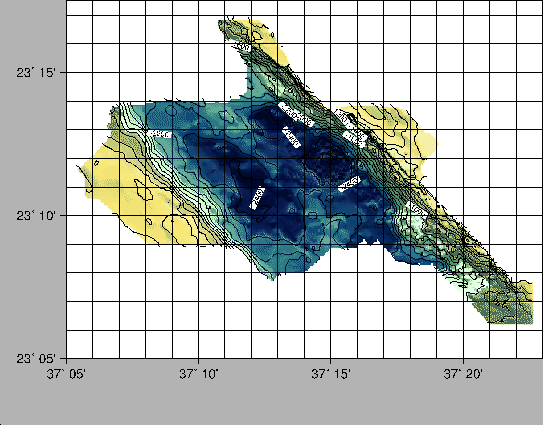
We have also produced a map of the Nereus Deep by merging the SEABEM data published by [Pautot (1983)] with the swaths we collected on the eastern flanks during the station approach, the brine sampling and the transit to N (Fig.(18). Since the SEABEAM data were apparently collected with a constant speed of sound of 1500 m/s, we tried to produce the best fit and applying the new function to the digitized contours, by