


Next: CHIRP SBP
Up: POSITIONING AND NAVIGATION
Previous: POSITIONING AND NAVIGATION
Contents
During the MCS acquisition we performed some CTD measurements.
The position of the stations are shown in
Figs. 3 and 4 and in Table 4.
Table 4:
MESC 2001 CTD Locations.
| STATION |
DATE |
LAT |
LON |
DEPTH |
| STAZ1 |
2001-07-28 |
3749.320 |
1538.040 |
1634.0 |
| STAZ2 |
2001-08-14 |
3830.080 |
1505.050 |
1093.0 |
|
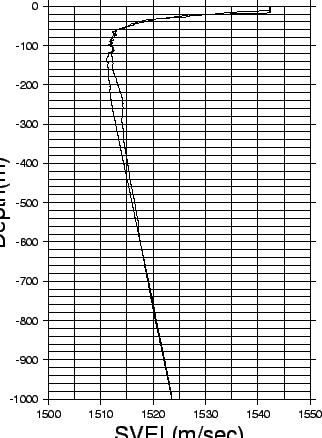
The data are presented in Figs. 8 and 9.
The SV profiles will be used for bathymetric post-processing.
figure
Figure 8:
T/S diagram of the whole data sample.
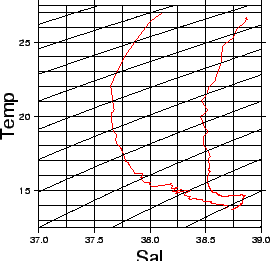 |
Figure 9:
Sound Velocity Profiles of the whole data sample.
 |
2001-11-30