next up previous contents
Next: CONCLUSIONS Up: PRELIMINARY RESULTS Previous: MICROSTRUCTURE AND TURBULENCE   Contents

MULTIBEAM

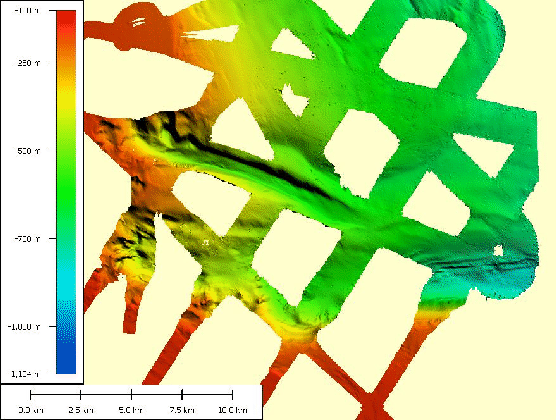
The multibeam data for the Bari Canyon area were processed with NEPTUNE. In spite of the large presence of spikes due to the concurrent ADCP acquisition, the obtained DTM is thought to have acceptable quality. Figure 27 shows the Bary canyon head and mid depth areas.

figure

Figure 27: Bari Canyon Bathymetry.
\begin{figure}\centerline{
\epsfig{ file=IMG/BC.ps,width=\linewidth}
}
\end{figure}

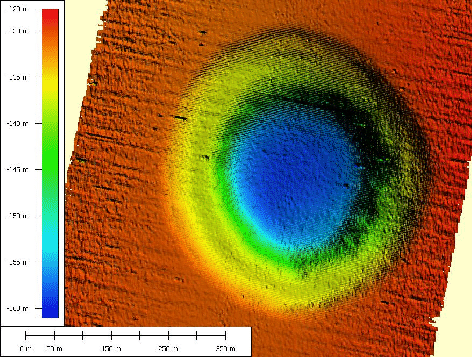
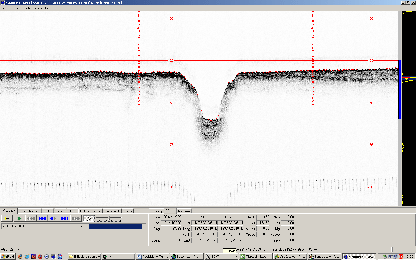
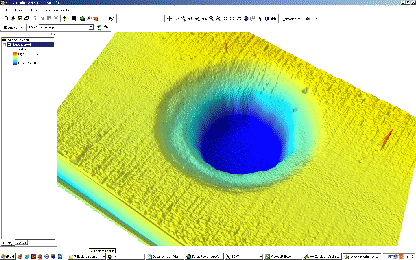
The multibeam system provides very high resolution data, as shown in the following figures where a depression having a diameter of about 400 m and about 30 m deep around the Gargano region is shown (DTM 0,5 m). Data have been treated using Neptune software. These depressions have been identified also in previous bathymetric surveys in the region, which genesis is still uncertain.

figure

Figure 28: Depression, processed by Neptune.
\begin{figure}\centerline{
\epsfig{ file=IMG/BUCO_NEPTUNE.eps,width=0.85\linewidth}
}
\end{figure}

figure

Figure 29: Depression found around the Gargano region. 3D model (diameter 400 m, 60 m depth), DTM 0.5 m resolution.
\begin{figure}\centerline{
\epsfig{ file=IMG/DEPRESSION_1.eps,width=0.75\linewidth}
}
\end{figure}

figure

Figure 30: Chirp Sonar profile of the depression above shown.
\begin{figure}\centerline{
\epsfig{ file=IMG/DEPRESSION_CHIRP.eps,width=0.75\linewidth}
}
\end{figure}


next up previous contents
Next: CONCLUSIONS Up: PRELIMINARY RESULTS Previous: MICROSTRUCTURE AND TURBULENCE   Contents
2009-12-16