CNR-ISMAR La Spezia processed the VM-ADCP data using the CODAS Software System (version 3), in order to scan the raw data files to ensure they are readable, identify gaps or other problems, to extract information needed to correct the recorded profile times in case the PC clock was in error compared to GPS time, load the data into a database suitable for processing and analysis, evaluate the quality of the data set as a whole by calculating and plotting diagnostic statistics (signal strength, percent good pings, error velocity, vertical velocity, and the vertical derivative of the horizontal velocity components), edit the profiles to eliminate bottom interference, velocity glitches due to interference from the CTD package etc., calibrate the profiler-heading device combination, reference the relative velocity profiles by calculating the ship's position at the end of each profile and the average velocity of the ship during the profile.
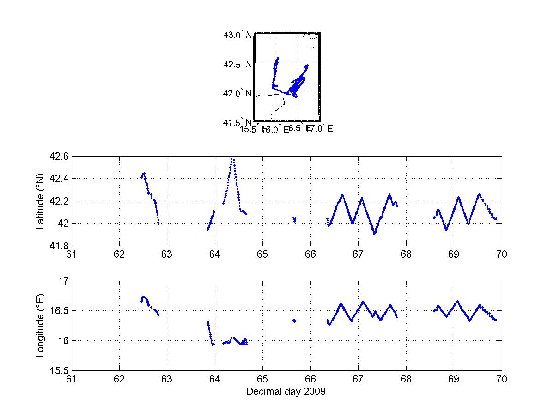
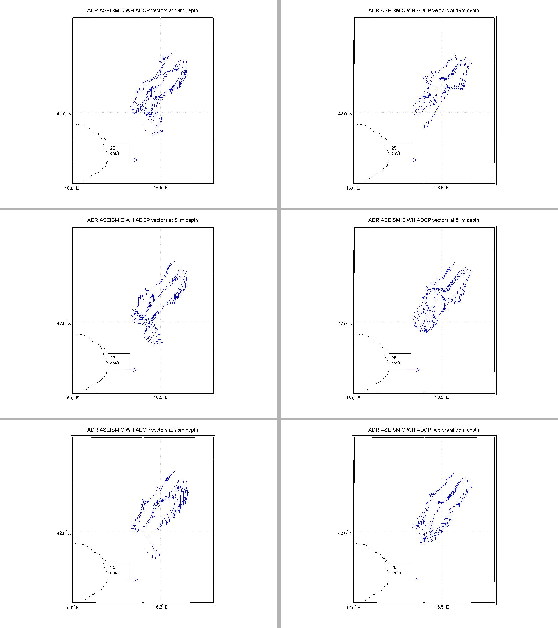
The ADCP data processing has partially been done with the CODAS Software System. Only data from WH 300 kHz of the first part of the cruise have been processed on board Figure 23 shows the navigation tracks and fig.24 shows the data along two transects.
figure
figure
 |