Oceanic transform boundaries lie on small circles defined by Eulerian POR and are manifested by narrow (a few km) strike-slip deformation zones offsetting two mid-ocean ridge segments [Wilson (1965),Fox and Gallo(1984)]. This is in contrast with continental strike slip deformation zones, such as the the San Andreas or the North Anatolian faults, defined by broad (>100 km), and very complex areas of deformation. The idea of simple, narrow, oceanic transform faults has found some exceptions in a few transforms with very large (>30 my) age offset [Ligi et al.(2002)]. The main example is the Romanche transform, that offsets the MAR in the equatorial Atlantic by over 900 km, with an age offset of ~50 my. Geophysical and petrological studies have shown that the Romanche has a lens-shaped, >120 km wide zone of deformation between the two ridge axis, with multiple strike slip faults as well as oblique structures; moreover, the basaltic crust is nearly absent within and close to the transform [Bonatti et al.(2001)]. Thus, the Romanche transform system has features similar to the large continental strike slip systems. Numerical models, based on thin viscous sheet, predict fault length to width ratios ranging from 5 to 10 for continental strik-slip zones [England et al.(1985)]. The Romanche transform has a ratio within the range of continental rather than oceanic transform zones [Ligi et al.(2002)]. Along this extra long, slow-slipping mega-transform, relative motion involves the deformation of extraordinarily thick and cold lithosphere A model that explains the complexities of the Romanche mega-transform has been proposed by [Ligi et al.(2002)]: megatransforms with very large age offset, affecting cold thick lithosphere, are unable to accomodate strike slip motion in a narrow single boundary. These authors analyzed the geometry and the evolution of lithosphere-dominated slow-slipping trasform faults employing a three-dimensional code to simulate mantle flow and thermal state beneath spreading ridges and a two-dimensional finite element code to model deformation of materials with complex visco-elastic brittle rheology. Results of the modelling suggest that the extreme thickness of the lithosphere, hence its rheology, is the most important factor in determining the unusual width and the complex geometry of mega-transforms. [Ligi et al.(2002)] constructed a numerical model to test how lithospheric thickness affects the geometry of an oceanic tranform boundary; they found that long-offset (900 Km) faults produce two major symmetrical faults joining the two ridge segments, with a lens-shaped area between, as observed around the Romanche Fracture Zone.
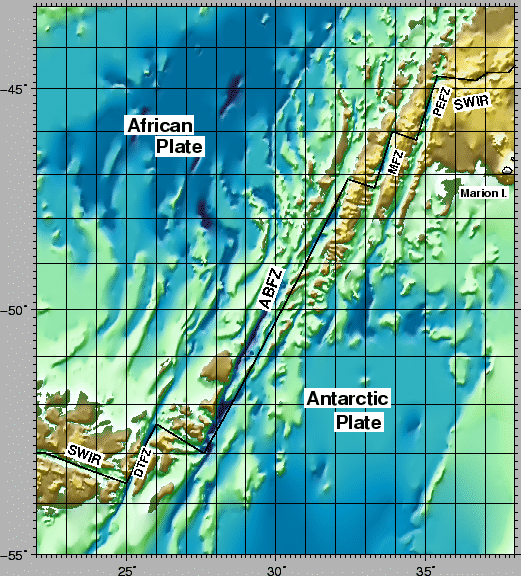
Another megatransform that may have features similar to those of the Romanche is the Andrew Bain transform, that offsets the SWIR by about 750 km and constitutes a portion of the boundary of the Antarctic Plate. Given the ultraslow spreading rate of the two plates adjacent to the transform, the slip rate is very small (16 mm/yr), and the age offset is rougly 50 million years. Andrew Bain is the longest of a set of close-spaced transforms that includes Du Toit on the south-western side, Marion and Prince Edwards on the north-eastern side
The Andrew Bain Transform is not well known, in part because it is located in a remote and quite inhospitable part of the ocean. It has been partly mapped [Grindlay et al.(1996),Sclater et al.(2005)] and has been sampled at only two sites [Fisher and Goodwillie(1997)]. Topography and satellite gravity derived maps show a broad, multifault, complex zone of deformation; present day seismicity is concentrated on a single linear structure. Oblique en echelon structures of unclear origin characterize the central part of the transform domain. [Sclater et al.(2005)] give a synthesis of the complexities of this transform, partly explained by a series of transtensional events resulting from past changes in the ridge/transform geometry.
The objective of the S23-AB06 cruise is therefore to have a better knowledge of this transform, in order to explain its complexities and to test [Ligi et al.(2002)] model.
figure