Two CTD stations were collected data along the >850Km line run westwardly parallel to the ABFZ. The SVP data of first one (CTD02, 2006-02-14) were processed, converted to ASCII, integrated with the Levitus Database (MB-System, routine mblevitus), imported into the PDS-2000 navigation system.
When the ship arrived at the southern RTI another Valeport CTD (CTD03, 2006-02-14 ) station was taken, the data processed as above, and input into the PDS-2000.
To be able to process the 850km line from CTD02 to CTD03 we had to prepare synthetic SV profiles along the line, to obtain a smooth transition between the two points of the segment.
Uisng the Levitus Database in MB-System and the two CTD profiles down to 2000m we generated
profiles named 1 to 9 (10 intervals of 80km) for input to the PDS-2000. The
data were filtered and resampled with GMT's filter1d and sample1d
routines. In the Appendix the scripts are explained in detail.
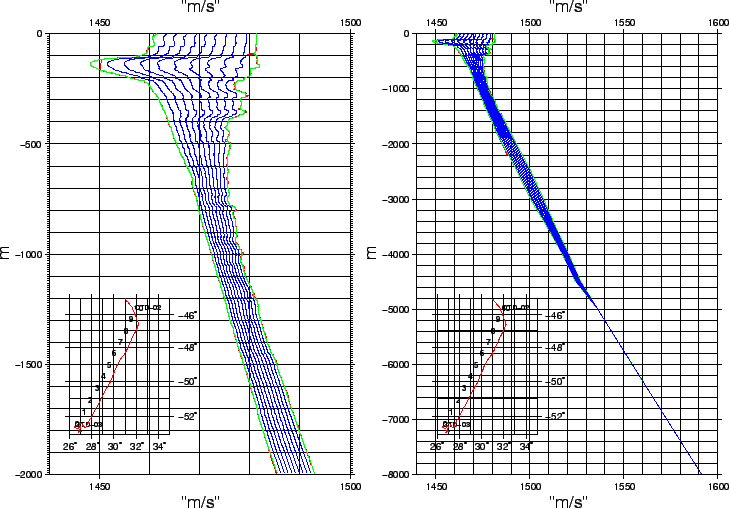
Figure 9 presents the modeled and measured SVP data .
figure
 |
All the PDS data files were therefore replayed according to the position along the transform, producing more accurate PDS-2000 and Simrad-like files.