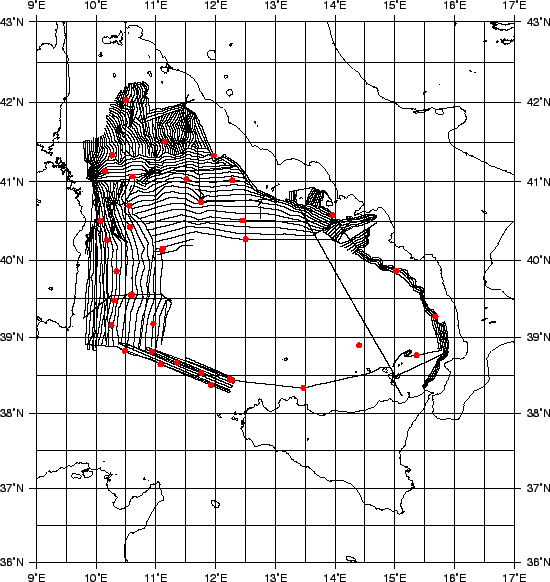
During the 1999 cruise a total of 16000 km of multibeam and magnetics lines were collected (see Fig.23.
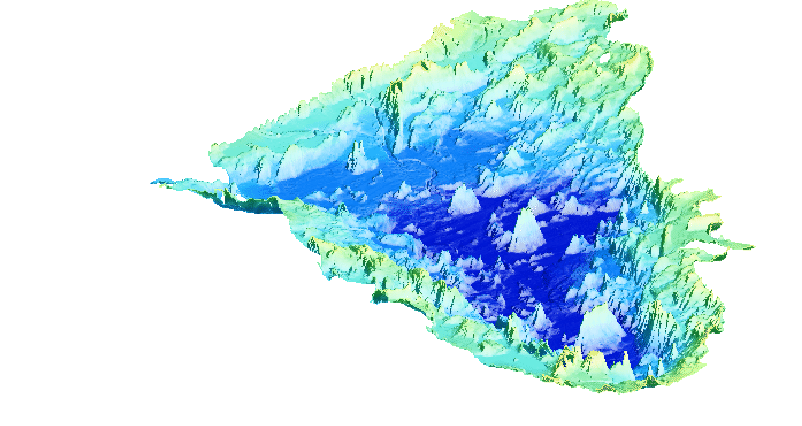
The multibeam data were edited and processed on-board, at the scales of 1:100000, 1:250000, 1:500000. The data quality ranged from very good to acceptable, mainly depending upon the weather conditions and investigated depths. The data acquired were merged with the data collected during the 1996 cruise. Fig.24 shows the result.
Magnetic recordings showed a good continuity and quality of data, requiring just a minimal pass for filtering prior to the IGRF-95 anomaly calculation.
Continuous Seismic profiling was done for almost the totality of the cruise, giving the chance to define the thickness of the sediments above the acoustic basament and the structural makeup of the area.
Gravimetry data were collected only during the second leg, and processing is ongoing to calculate free air and Bouguer anomalies.
Several XBT and some XCTD launches were done. The data will be
useful for the better reprocessing of the Multibeam data and will provide
good oceanographic information at the basin level.
During the 60 days cruise TIR99 a good quality morpho-bathymetric and
geophysical data set was collected in the Tyrrhenian Sea, up to minimum depths
of about 500 m in almost all margins. The
integration with the same data collected during cruise TIR96 was performed on board.
figure
figure