next up previous contents
Next: CRUISE TIR99 Up: CRUISE TIR96 Previous: COMPUTING FACILITIES AND ON   Contents


RESULTS

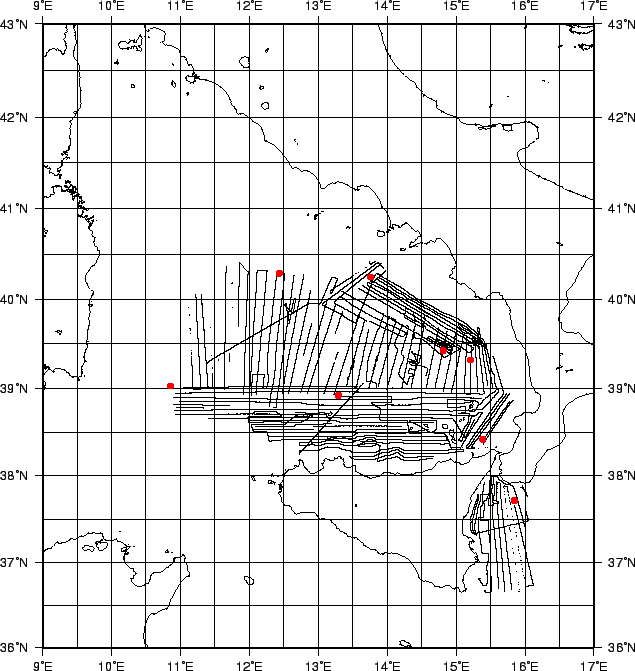
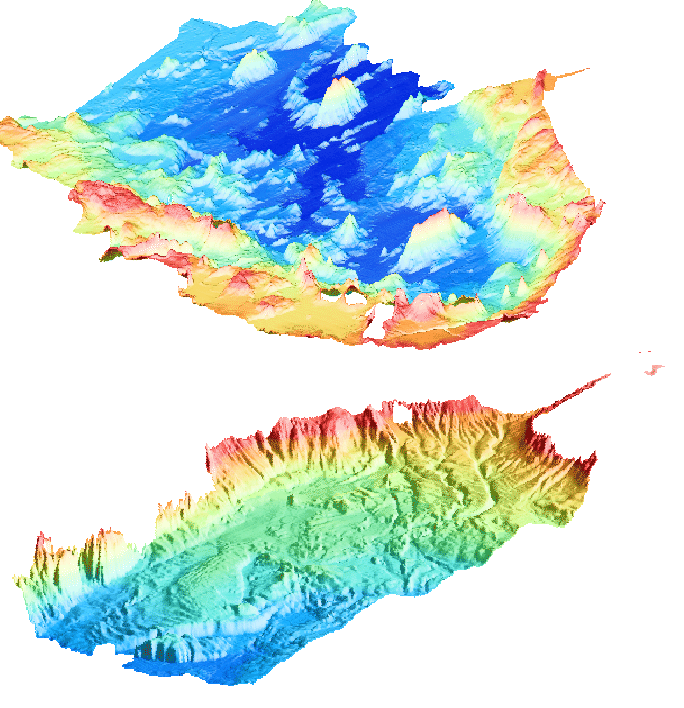
Fig.9 shows the pattern of lines acquired during the multibeam runs. Fig.10 presents shaded relief maps of the multibeam data, gridded at 250 m (Tyrrhenian Sea) and 100 m intervals (Ionian Sea).

The multibeam data were edited and processed on-board, at the scales of 1:100000, 1:250000, 1:500000. The data quality ranged from good to acceptable.

Magnetic recordings showed a good continuity and quality of data, requiring just a minimal pass for filtering prior of the IGRF-95 anomaly calculation.

Continuous Seismic profiling was done for almost the totality of the cruise, giving the chance to define the thickness of the sediments above the acoustic basament and the structural makeup of the area.

Gravimetry data were collected during the whole cruise, and processing is ongoing to calculate free air and Bouguer anomalies.

figure

Figure 9: Navigation lines acquired during cruise TIR96
\begin{figure}\centerline{\epsfig{bbllx=20,bblly=20,bburx=550,bbury=600,
file=TIR96_SUMMARY.ps,
width=15cm} }\end{figure}

figure

Figure 10: Multibeam data acquired during cruise TIR96. Top: shaded relief with azimuth from 45/315. Projection UTM, Zone 33, southern margin Tyrrhenian Sea. Below: shaded relief with azimuth from 135. Projection Direct Mercator on 40N, north western margin Ionian Sea.
\begin{figure}\centerline{\epsfig{bbllx=130,bblly=100,bburx=565,bbury=350,
file...
...x=130,bblly=60,bburx=550,bbury=280,
file=ion_200_3d.ps,width=15cm}}\end{figure}


next up previous contents
Next: CRUISE TIR99 Up: CRUISE TIR96 Previous: COMPUTING FACILITIES AND ON   Contents
2001-07-13