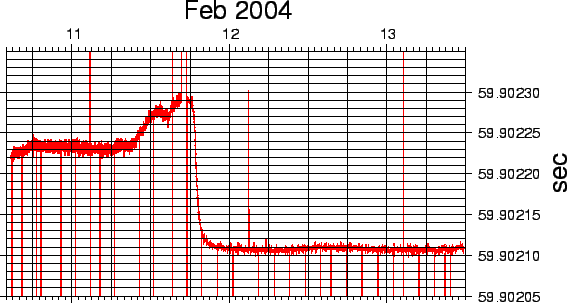
This section presents here the results obtained while testing the event timestamping with
the AcutimeTM
interface. We connected the event input of the AcutimeTM
Synchronization Kit to a Quartz-Controlled Time
Base Generator, set to 59.2 seconds. The time differences between each timestamp
were then plotted on a Time Series plot, as shown in Fig.19.
At a first glance we are able to see that the maximum error is about 250
microsec, to be taken into account for seismic purposes.
The signal rise side started at 2004-02-11 09:00, there was lack of data 16:30 to 17:30 and
a steep descending step began at 18:00. This behaviour should be investigated further, either on the
GPS constellation management or on the TB side. In addition,
there were some spikes, both for positive or negative time
differences. In spite of the above problems, we can see that the data seem to be
quite stable, and well within the AcutimeTMspecification.