SBP data was acquired by the 16 transducers, hull mounted BENTHOS (DATASONICS) Mod.CAP-6600 CHIRP-II profiler, with operating frequencies ranging between 2 and 7 kHz. The pulse length was mantained at 20 ms while the trigger rates varied from 0.25 to 1 seconds according to water depth. Digital data acquired by the Communication Technology SWANPRO software were recorded in the XTF format on local disks and transferred on the network upon request. Backups were loaded on HD and DVD. The navigation data was made available to the system as lat/long by NMEA sentences of the DGPS receiver at a rate of aproximately 1 Hz or by the PDS200's NMEA at 1Hz. The XTF data were then converted to SEG-Y by the Triton-Elics's Xtf2Seg software. This latter data were then input to the ISMAR's SEISPRO software SEISPHRO for data processing and display.
figure
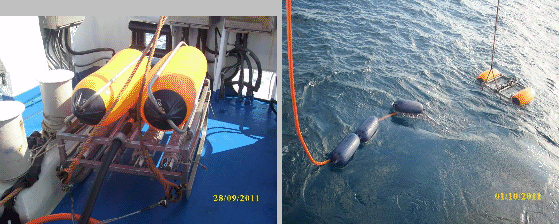
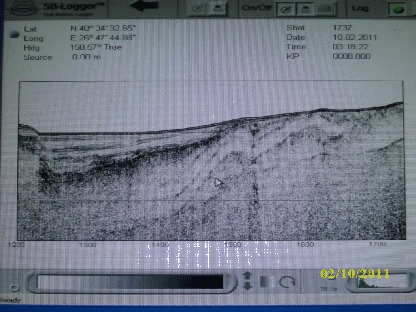
A 1.5 KJ Multi Tip sparker GEO-SOURCES by Geo-reosurces was towed astern on the starboard side (Fig.5). The power was generally set to 1.3 KJ. A 10 m long streamer was deployed on the port side by a 3m divergent and weights were set for towing at less than 0.5m water depth. The streamer data passed trough a fixed gain preamplifier and were digitized by a SB-Logger by Triton Imaging (Fig.6), that produced data files in the SEGY format.
figure
An Edgetech 4200 FS (100 and 400 Khz) was used. The sonar data have been store in the Edgetch's Jstar (.jsf) and Triton-Imaging XTF formats.
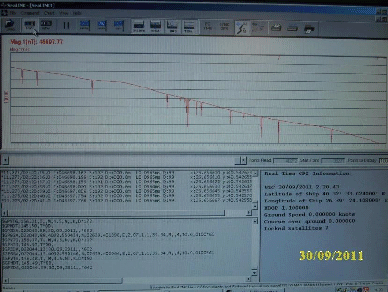
A Marine Magnetics Seaspy magnetometer was used and deployed from the port side. The data were acquired by the Sealink software (Fig.SEALINK).
figure