


Next: CONCLUDING REMARKS AND FUTURE
Up: DESCRIPTION OF DEPLOYMENTS AND
Previous: CHIRP SBP
Contents
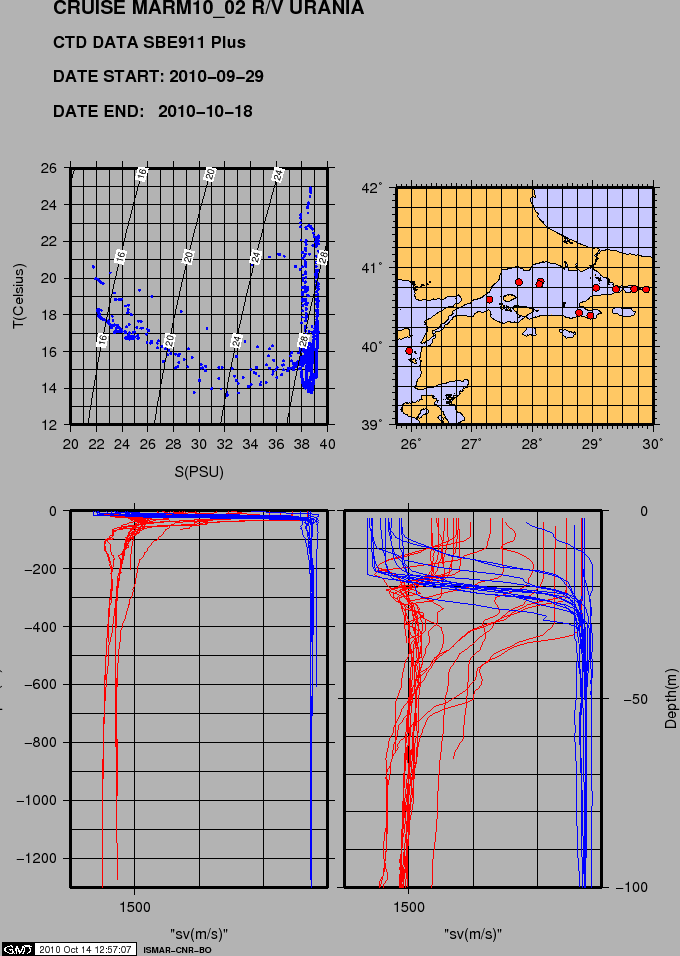
Figure 17 shows the SV profiles, the TS diagram and location
of the CTD casts, in Marmara and the Dardanelles.
figure
Figure 17:
Cruise MARM10_02 CTD casts. Lower left: Sound Velocity(gray), T(red,12-26),
S(blue, 20-40PSU). Lower right: TS diagram.
 |
2011-03-16