


Next: Potential Temperature VS Salinity
Up: PRELIMINARY RESULTS
Previous: CTD CASTS
Contents
figure
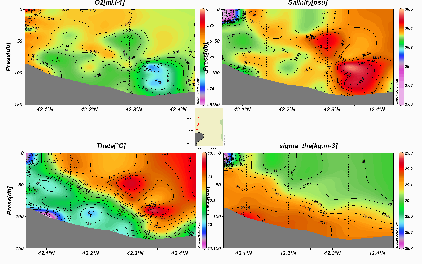
Figure 17:
Distribution of oxygen, salinity, potential temperature and potential density along the transect DL3-DL10.
 |
figure
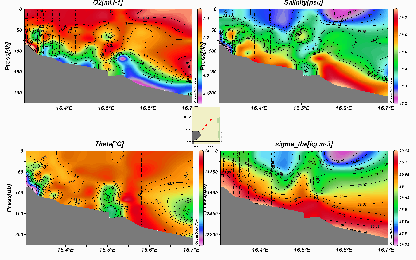
Figure 18:
Distribution of oxygen, salinity, potential temperature and potential density along the transect VL3-VL13.
 |
figure
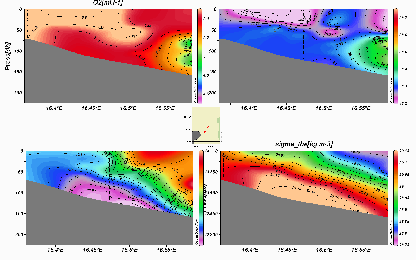
Figure 19:
Distribution of oxygen, salinity, potential temperature and potential density along the transect ML2-ML8.
 |
figure
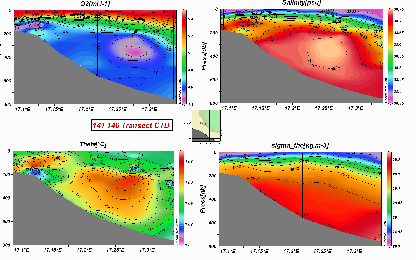
Figure 20:
Distribution of oxygen, salinity, potential temperature and potential density along the transect 141-146.
 |
2009-12-16