


Next: CONCLUSIONS
Up: INITIAL RESULTS
Previous: MULTICHANNEL REFLECTION SEISMIC
Contents
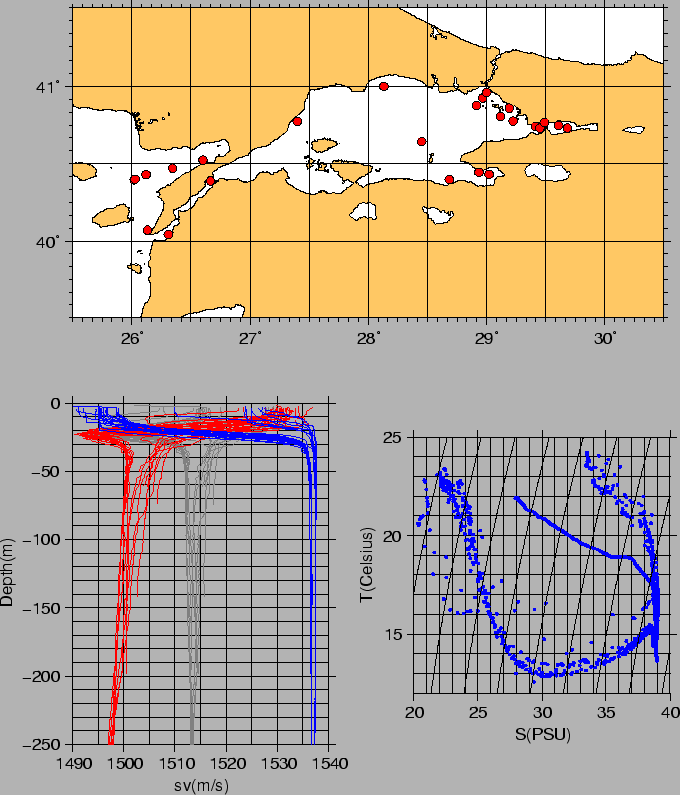
Figure 25 shows the SV profiles, the TS diagram and location
of the CTD casts, in Marmara and the Aegean Sea.
figure
Figure 25:
Cruise MARM05 CTD casts. Lower left: Sound Velocity(gray), T(red,12.5-25),
S(blue, 20-40PSU). Lower right: TS diagram.
 |
2005-12-08