


Next: BATHYMETRY
Up: INITIAL RESULTS
Previous: INITIAL RESULTS
Contents
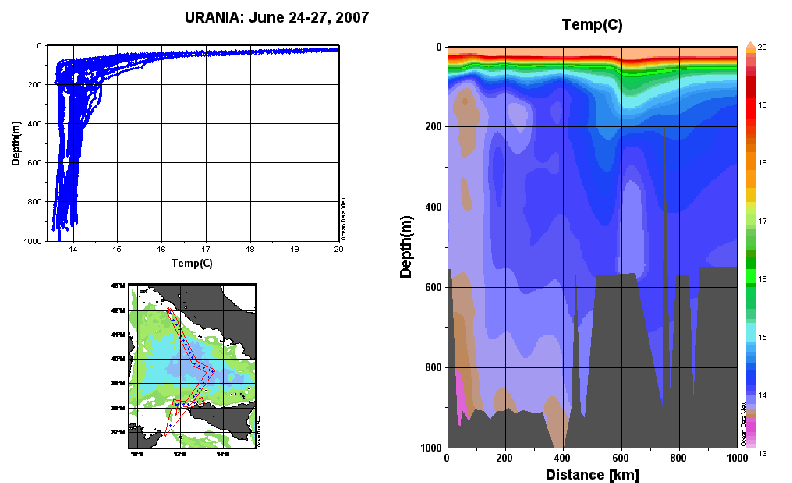
Figure 8 shows the Tyrrhenian Sea section
obtained by using the quality controlled XBT temperature profiles (ODV plot).
Figure 8 shows the Tyrrhenian Sea section obtained by using the quality controlled XBT temperature profiles (ODV [Schlitzer(2004)] plot).
figure
Figure 8:
Cruise MS07. XBT temperature data section, by ODV processing.
 |
2007-08-23