next up previous contents
Next: SEABED SAMPLING Up: INITIAL RESULTS Previous: MAGNETICS   Contents

GRAVIMETRY

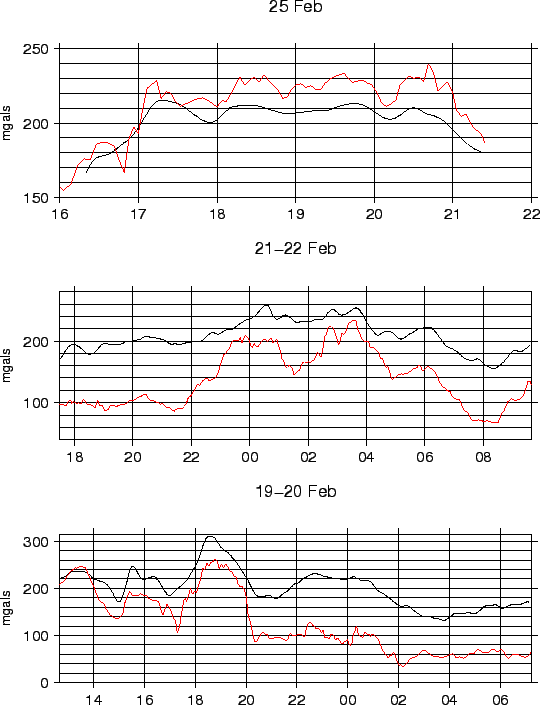
Figure 23 shows the gravimetric anomaly and depth along three runline. Despite of instrumental accuracy of 0.2 mgals , we can estimate a true accuracy of the order of several mgals, due to thermal instabilities, storms, non-linear drift of gravimeter because of long period of work.

Figure 23: Example of filtered anomaly gravity data collected along some lines. Red lines: bathymetry.
\begin{figure}\centerline{\epsfig{file=IMG/GRAV_DATA.ps,width=12.5cm}}
\end{figure}


2006-06-03