Pattern of the multibeam lines during operation in the study area
are presented in Fig.4. A surface area of approximately 35000 km![]() was
covered in the survey..
Partial processing of the acquired data by the RESON 8150 was carried-out
during the cruise with the Neptune, MB-SYSTEM and PDS-2000 software.
The quality of the data acquired varied from good to acceptable,
excluding lines run in bad weather conditions because of the rough seas.
was
covered in the survey..
Partial processing of the acquired data by the RESON 8150 was carried-out
during the cruise with the Neptune, MB-SYSTEM and PDS-2000 software.
The quality of the data acquired varied from good to acceptable,
excluding lines run in bad weather conditions because of the rough seas.
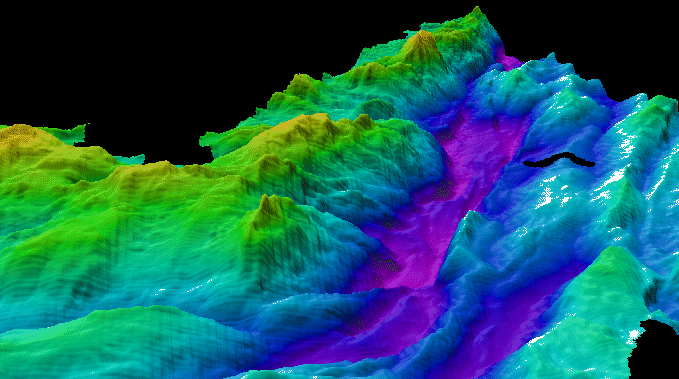
The DTM were produced in projection (Direct Mercator and UTM) and geographical domains, with the point clouds of post-processed data, using GMT's and ISMAR routines.
Fig.21 shows a 3-d view of the ABFZ southern RTI.